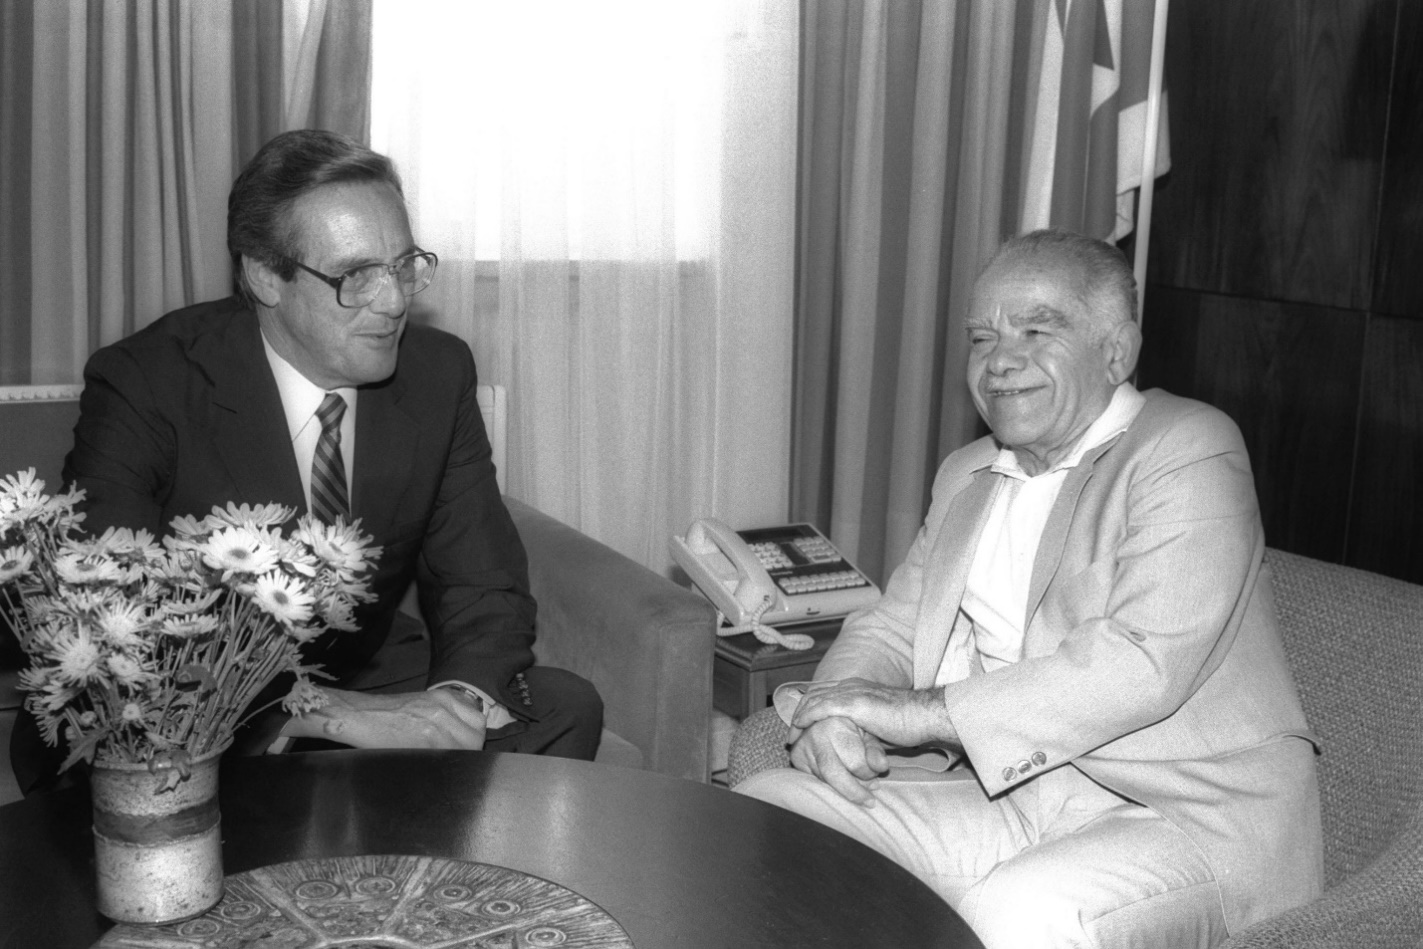
U.S.-Israel Free-Trade Agreement, 1985

August 19, 1985
Introduction
Israel and the United States enacted a free-trade agreement (FTA) in August 1985 with the explicit goal not only of strengthening bilateral relations and expanding trade, but also of boosting a struggling Israeli economy “still in a process of development.” Four years earlier, the US and Israel signed a Strategic Cooperation Agreement enhancing their collaboration against Soviet threats to the Middle East. Signed by in April 1985 by Israeli Trade Minister Ariel Sharon and U.S. Trade Representative William Brock, the FTA phased out tariffs on manufactured goods and other trade barriers, with a few exceptions to protect such Israeli agricultural products as apples, almonds, peaches and hummus. Tariffs were fully eliminated by effect Jan. 1, 1995. Israel generated about $11 million in tariffs on U.S. goods in 2024. A 1996 deal on agricultural products, updated in 2004 and renewed annually since 2009, supplemented the 1985 free-trade agreement, which itself built on an economic cooperation agreement the two countries signed a decade earlier.
Israel’s free-trade agreement was the first of more than a dozen for the United States, coming eight years before the North American Free Trade Agreement. The US and Jordan signed an FTA in October 2000, the first between the US and an Arab country. Within a decade Jordan’s exports to the US increased from $15million to over $1 billion. The US-Israel pact reflected President Ronald Reagan’s policy of lowering trade barriers to boost international commerce and thus expand the economies of the United States and its trading partners. In the first 40 years of the agreement, annual U.S. exports to Israel increased 473.4%, according to the Office of the U.S. Trade Representative.
The FTA also was the first for Israel with one country and its second overall, joining a 1975 deal with the European Economic Community, precursor to the European Union. The U.S. deal came at the end of Israel’s economic “Lost Decade” and two months after Prime Minister Shimon Peres’ national unity government implemented the Economic Stabilization Program to halt runaway inflation.
Israel has maintained an annual trade surplus with the United States for 30 years
U.S.-Israel Annual Trade in Goods
| Year | U.S. Exports (billions) | Israeli Exports (billions) | Balance (U.S. +/-, billions, rounded) |
| 1985 | $2.58 | $2.12 | +$0.46 |
| 1986 | $2.24 | $2.42 | -$0.18 |
| 1987 | $3.13 | $2.64 | +$0.49 |
| 1988 | $3.24 | $2.97 | +$0.27 |
| 1989 | $1.05 | $1.66 | -$0.61 |
| 1990 | $3.20 | $3.31 | -$0.11 |
| 1991 | $3.91 | $3.48 | +$0.43 |
| 1992 | $4.08 | $3.82 | +$0.26 |
| 1993 | $4.43 | $4.42 | +$0.01 |
| 1994 | $5.00 | $5.23 | -$0.23 |
| 1995 | $5.62 | $5.71 | -$0.09 |
| 1996 | $6.01 | $6.43 | -$0.42 |
| 1997 | $5.99 | $7.33 | -$1.33 |
| 1998 | $6.98 | $8.64 | -$1.66 |
| 1999 | $7.69 | $9.86 | -$2.17 |
| 2000 | $7.75 | $12.96 | -$5.22 |
| 2001 | $7.48 | $11.96 | -$4.48 |
| 2002 | $7.03 | $12.42 | -$5.39 |
| 2003 | $6.89 | $12.77 | -$5.88 |
| 2004 | $9.17 | $14.55 | -$5.38 |
| 2005 | $9.74 | $16.83 | -$7.09 |
| 2006 | $10.96 | $19.17 | -$8.20 |
| 2007 | $12.89 | $20.79 | -$7.91 |
| 2008 | $14.49 | $22.34 | -$7.85 |
| 2009 | $9.56 | $18.74 | -$9.19 |
| 2010 | $11.30 | $20.98 | -$9.69 |
| 2011 | $13.96 | $23.05 | -$9.09 |
| 2012 | $14.27 | $22.13 | -$7.86 |
| 2013 | $13.74 | $22.78 | -$9.04 |
| 2014 | $15.07 | $23.01 | -$7.93 |
| 2015 | $13.54 | $24.49 | -$10.96 |
| 2016 | $13.20 | $22.20 | -$9.00 |
| 2017 | $12.55 | $21.95 | -$9.40 |
| 2018 | $13.71 | $21.79 | -$8.08 |
| 2019 | $16.34 | $19.53 | -$3.19 |
| 2020 | $11.22 | $15.26 | -$4.04 |
| 2021 | $12.87 | $18.69 | -$5.83 |
| 2022 | $14.18 | $21.43 | -$7.24 |
| 2023 | $13.98 | $20.82 | -$6.84 |
| 2024 | $14.79 | $22.22 | -$7.43 |
Source: U.S. Census Bureau; figures do not include trade in services, in which Israel also runs a surplus.
— Michael Jacobs, April 7, 2025