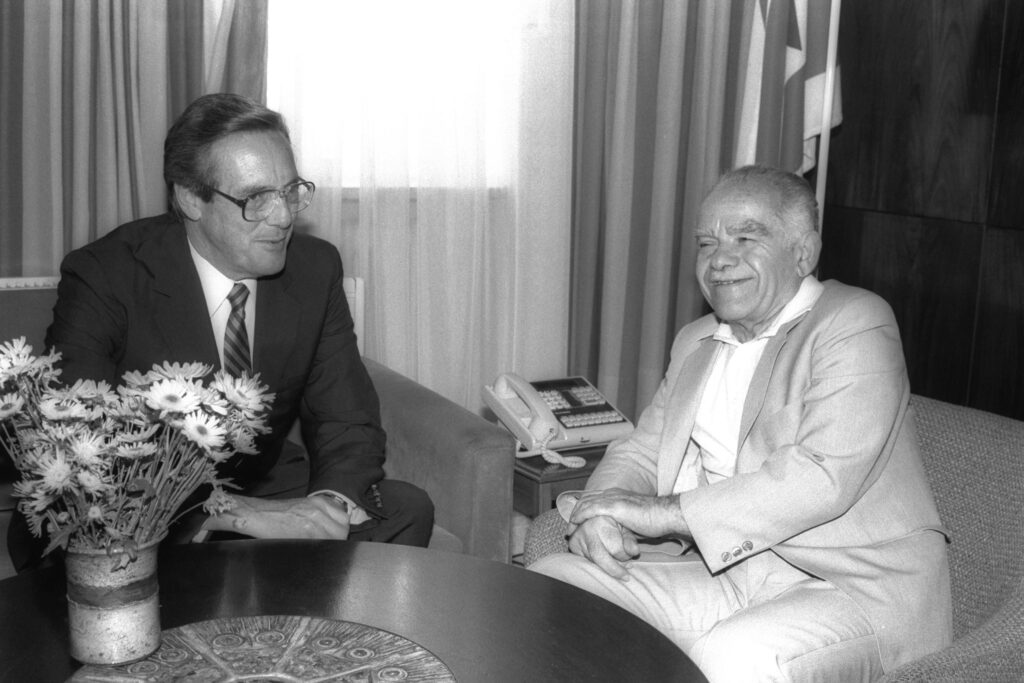
The deal to mutually phase out tariffs on manufactured goods over a decade is the first free-trade agreement for the United States and the second for Israel, after one reached with a precursor to the European Union.
![]()
The deal to mutually phase out tariffs on manufactured goods over a decade is the first free-trade agreement for the United States and the second for Israel, after one reached with a precursor to the European Union.
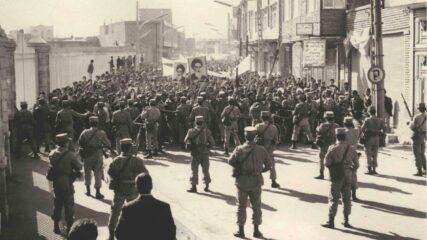
For those looking for the best reads and watches on Iran and its relations with Israel, the United States and the Jewish people, CIE has compiled analyses, videos, documents and books.
While too much is unknown after a week of fighting to make definitive statements about the war, certain possible outcomes can be explored.

Turkish-Israeli relations have swung between friendship and hostility since Turkey became the first Muslim-majority country to recognize Israel in 1949.
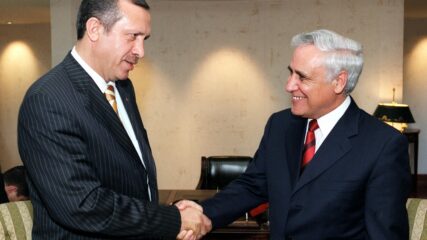
A collection of books and articles providing insights into the history and current situation of Turkey and its relations with Israel.

Maya Rezak and Ken Stein, February 27, 2026 Hussain Abdul-Hussain, “Why Saudi Arabia is Turning Back to Islamism – and Against Israel,” Foundation for the Defense of Democracies, February 6, 2026. Al-Arabiya, (editorial) “The Crisis…
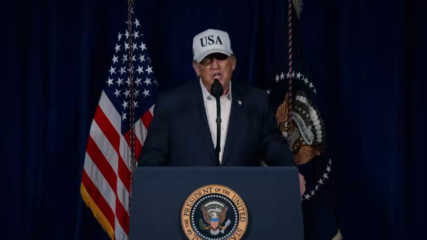
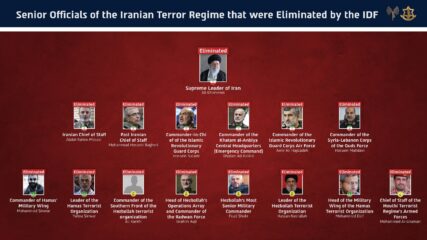
President Donald Trump announces Operation Epic Fury, the second U.S. attack on Iran’s nuclear and ballistic missile programs in eight months, and urges the Iranian people to overthrow their Islamic regime.
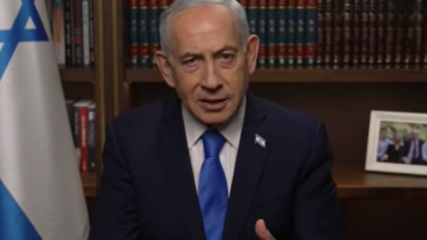
Prime Minister Benjamin Netanyahu announces Operation Roaring Lion and briefly explains why Israel, with U.S. help, has attacked the nuclear and ballistic missile capabilities of Iran. He also encourages the Iranian people to topple their regime.
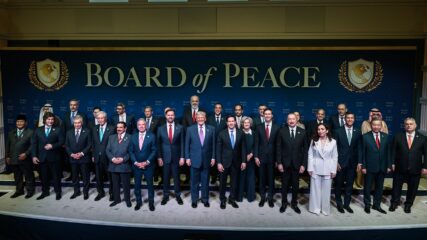
The first meeting of the Board of Peace convened under the Trump ceasefire for Gaza offers grand plans for reconstruction and a vibrant, peaceful future for Palestinians but depends on the disarmament of Hamas.
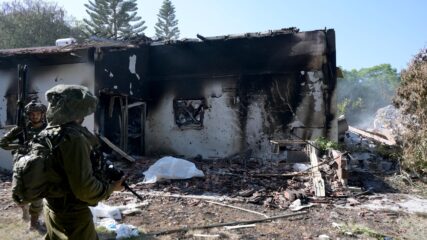
CIE President Ken Stein addresses what is and what is not known about why Hamas attacked October 7, 2023, why Israel was caught off guard, and what happens after the war across the region.