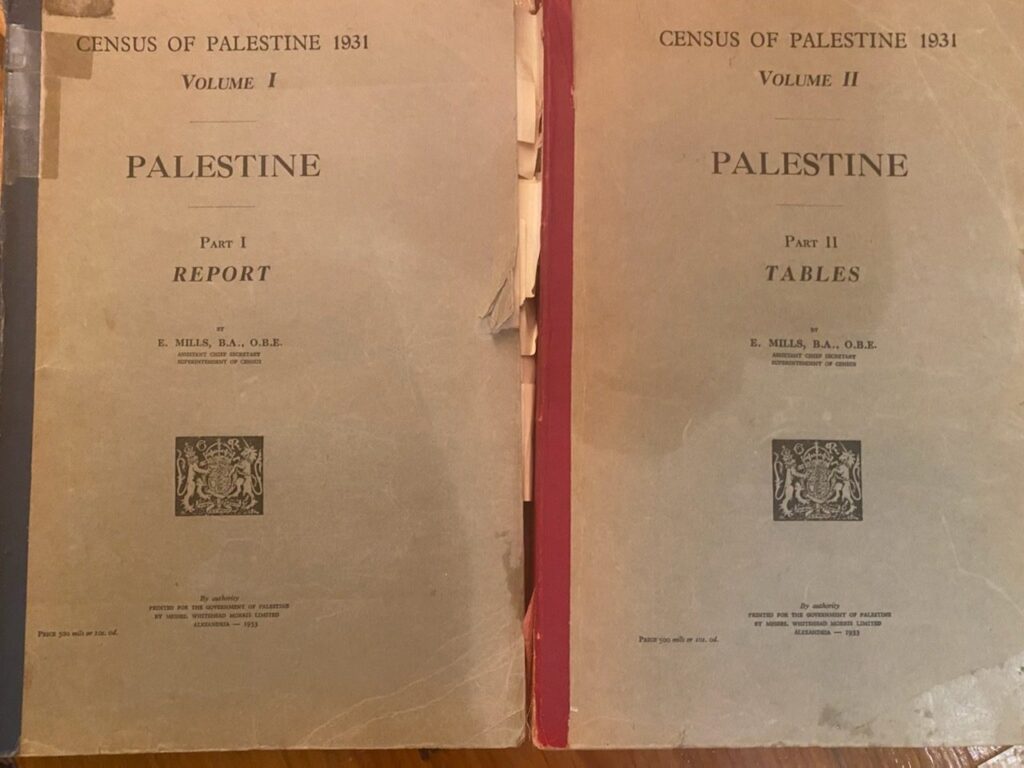
An invaluable glimpse at Palestine's population: gaping socio-economic distances and vast communal differences between Muslims, Christians and Jews that set the strong preferences for separation of the populations.
![]()
An invaluable glimpse at Palestine's population: gaping socio-economic distances and vast communal differences between Muslims, Christians and Jews that set the strong preferences for separation of the populations.

After his urging compromise on the proposed judicial overhaul, President Isaac Herzog, in the starkest of terms, says Israel is approaching the “abyss of a civil war” as opponents and proponents head toward a showdown. He characterizes the proposed overhaul as “wrong, oppressive, and undermines our democratic foundations.”

As a lifetime soldier-politician, Rabin acknowledges that the signing of the Declaration of Principles was profoundly difficult, and yet there is a yearning to end the cycle of violence and engage in reconciliation with the Palestinians. Drawing inspiration from Jewish tradition, he stresses the timeliness of pursuing peace and prays for a new era in the Middle East.
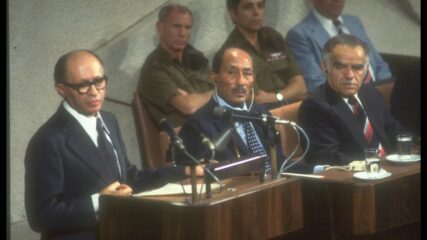
Begin welcomes Sadat’s bold initiative, seeking an end to the conflict with other Arab states through negotiated treaties. Begin invites other Arab leaders to negotiate as Sadat was doing.
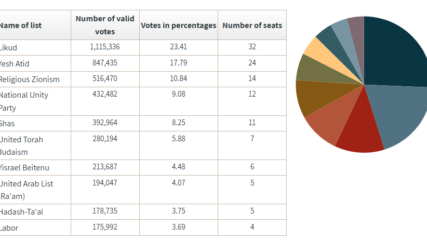
CIE President Ken Stein speaks with the Atlanta Jewish Times in advance of the October 2026 election about differences between the U.S. and Israeli electoral systems.

Chaim Weizmann, a top Zionist leader, vividly pronounced parallel Jewish realities in 1938: disaster confronting Jews in Europe and advanced state building in Palestine. Ten years later history was written.

Updated July 10, 2026; originally posted October 2023. By Ken Stein Hamas’ Origins The 1988 Hamas Charter and remarks by its leaders and other publications express hatred of Zionism, Israel and Jews. It is thus unmistakable that Hamas…
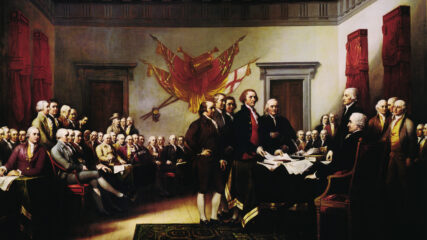
By Ken Stein, President, Center for Israel Education A short comparison of key concepts found in the American Declaration of Independence, July 4, 1776, and the Israeli Declaration of Independence, May 14, 1948. CIE+ Reliable…

By Maya Rezak and Ken Stein, June 30, 2026 Videos and Multimedia Center for Israel Education, “Six Days that Redrew the Map of the Middle East,” audio playlist. Kirsten Fontenrose, Damian Murphy and Brian Katulis,…
Correctly observing that the vast majority of Palestinian Arab peasants were trapped in debt with interest rates between 30% and 70%, this British civil servant suggested establishing agricultural cooperatives. But neither Arab leaders nor British bureaucrats wanted to provide the funding. For the duration of the Mandate, the Palestinian peasant remained hard-working, sullen and impoverished.